One-year rise in Annex I emissions = Total emissions of over 100 million Indians
The data show that CO2 emissions from this group (excluding the ex-Soviet economies in transition) have increased by 16 per cent since 1990. Since the last report in 2006, CO2 emissions increased by 1.1 per cent, which works out to an increase of 128 million tons. This one-year increase is more than the total CO2 emissions of 100 million people living in India. Other key numbers:
|
||||||||||||||||||||||||||||||||||||||||||
These figures are a strong reminder of the gap between rhetoric and results among many rich nations. Emissions increases in the energy industry and transportation sectors are particularly troubling, given that the industrialised countries cannot meet science-based targets without cutting these emissions.
In the European Union, some countries have cut emissions, but in many cases, historical anomalies deserve much of the credit. For example:
- The UK discovered natural gas in the early 1990s, allowing it to shut down dirtier coal plants;
- Germany saw emissions drop through the 1990s due to economic collapse in the former East Germany.
In addition, in some EU countries like Luxembourg the entire reduction in emissions has been through buying offsets. Thus, while it may look like Luxembourg’s emissions are on the decline, the real emissions cuts are happening beyond its borders. Luxembourg’s domestic emissions have in fact increased over the years.
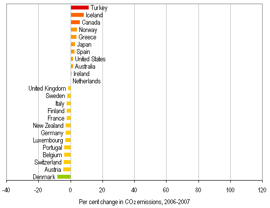
Charts 1 and 2 show how CO2 emissions have grown—or in a few cases declined—in a range of Annex I countries. Chart 1 shows overall changes from 1990 to 2007; chart 2 shows the one-year change from 2006 to 2007. Among major economies, Australia, Canada, Japan, Norway and the US lead the pack for emissions increases.
Charts 3 and 4 show sector-wise emissions increases and decreases for all Annex I countries (excluding economies in transition). The same trends seen for Australia, Canada, Japan and the US—namely, that energy industry and transportation emissions are rising rapidly—can be seen for Annex I as a whole.
UNFCCC Executive Secretary Yvo de Boer commented on the new data in an official release. “The continuing growth of emissions from industrialised countries remains worrying,” he said. “The numbers for 2007 underscore, once again, the urgent need to seal a comprehensive, fair and effective climate change deal in Copenhagen in December.”
He’s right.
Chart 1 Chart 2 1990-2007 changes in CO2 emissions - Selected Annex I countries 2006-2007 changes in CO2 emissions - Selected Annex I countries
 View chartView chart
Chart 3 Chart 4 1990-2007 changes in CO2 emissions, by sector Annex I total (excluding economies in transition) 1990-2007 changes in Energy-Related CO2 emissions, by sub-sector Annex I total (excluding economies in transition)
 View chartView chart

Share this article